Currently, only geometries of the same type can be plotted in the same plot call (geometries are promoted to mutli-geometries if needed).
geo_plot(
  x,
  ...,
  asp = 1,
  bbox = geo_bbox(x, finite = TRUE),
  xlab = "",
  ylab = ""
)

geo_plot_add(x, ...)

# S3 method for default
geo_plot_add(x, ...)

# S3 method for geovctr
geo_plot_add(x, ...)

# S3 method for data.frame
geo_plot_add(x, ...)

# S3 method for `NULL`
geo_plot_add(x, ...)

# S3 method for geovctrs_xy
geo_plot_add(x, ...)

# S3 method for geovctrs_segment
geo_plot_add(x, ...)

# S3 method for geovctrs_rect
geo_plot_add(x, ...)

# S3 method for geovctrs_collection
geo_plot_add(x, ...)

# S3 method for sf
geo_plot_add(x, ...)
Arguments
| x | A geometry-like object, or one that can be
coerced to a geometry-like object using |
|---|---|
| ... | Passed to plotting functions for features: |
| asp, xlab, ylab | Passed to |
| bbox | The limits of the plot. Defaults to |
Value
x, invisibly.
Examples
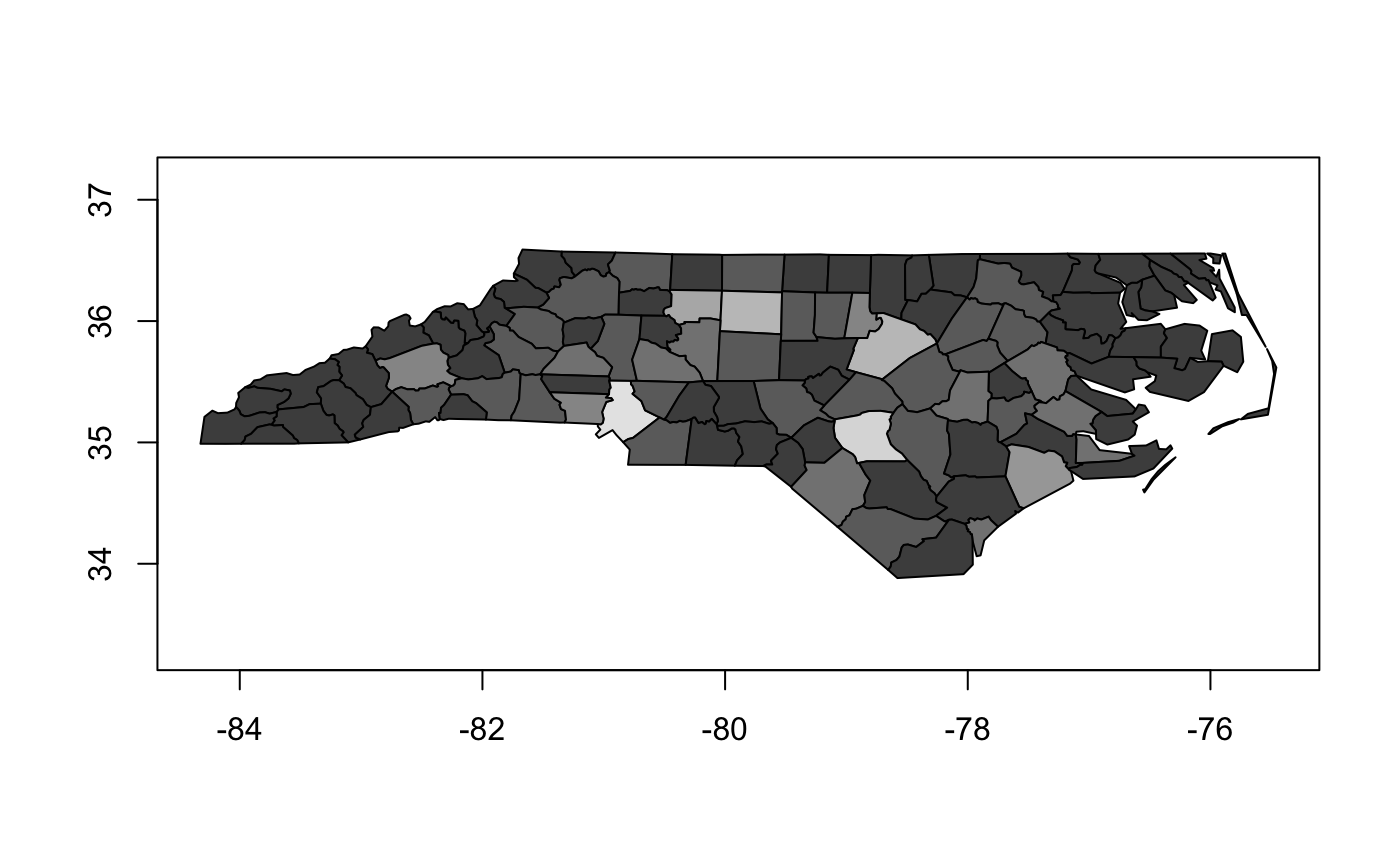
geo_plot( geo_wkt( "MULTIPOLYGON (((40 40, 20 45, 45 30, 40 40)), ((20 35, 10 30, 10 10, 30 5, 45 20, 20 35), (30 20, 20 15, 20 25, 30 20)))" ), col = "grey90" )# can also plot data frames that have exactly one geovctr column prev_pal <- palette(grey.colors(10)) geo_plot(geo_nc, col = cut(BIR79, 10))