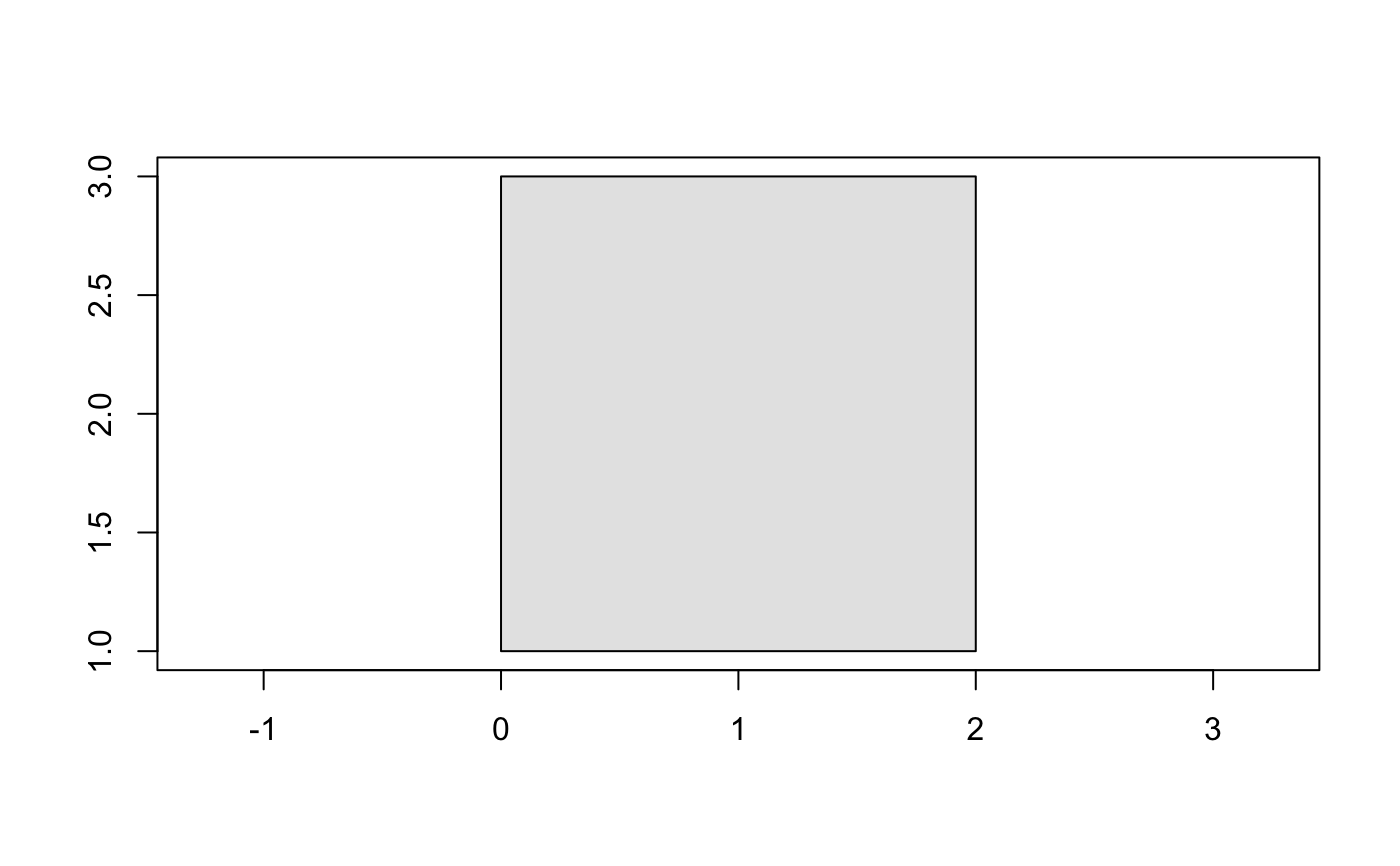
These functions are basic plot implementations for the geovctrs types.
Similar plot() methods are available for well-known types
in the wkutils package.
# S3 method for geovctrs_xy
plot(
  x,
  ...,
  add = FALSE,
  asp = 1,
  bbox = geo_bbox(x, finite = TRUE),
  xlab = "",
  ylab = ""
)

# S3 method for geovctrs_segment
plot(
  x,
  ...,
  add = FALSE,
  asp = 1,
  bbox = geo_bbox(x, finite = TRUE),
  xlab = "",
  ylab = ""
)

# S3 method for geovctrs_rect
plot(
  x,
  ...,
  add = FALSE,
  asp = 1,
  bbox = geo_bbox(x, finite = TRUE),
  xlab = "",
  ylab = ""
)
Arguments
| x | A geometry-like object, or one that can be
coerced to a geometry-like object using |
|---|---|
| ... | Passed to plotting functions for features: |
| add | Should the object be added the current plot? |
| asp, xlab, ylab | Passed to |
| bbox | The limits of the plot. Defaults to |
Value
x, invisibly.


