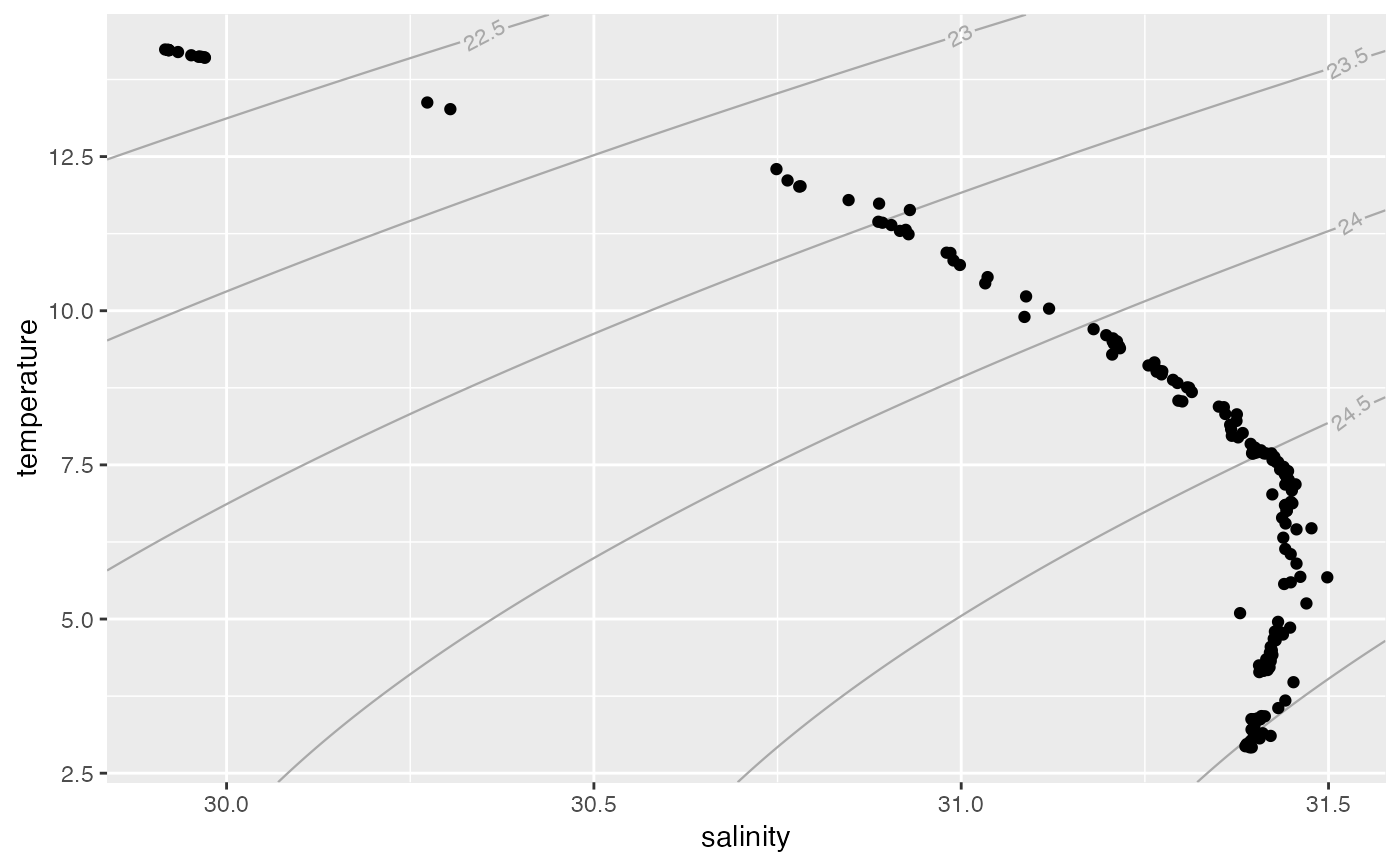
Draws density contour lines ("isopycnals") as a ggplot2 layer. The
x axis is assumed to be salinity; the y axis is assumed to be
temperature. To use this geometry as standalone layer, you will need
to specify which type of temperature (i.e., in-situ or conservative)
and salinity (i.e., practical or absolute) are on these axes.
geom_isopycnal(
  mapping = NULL,
  data = NULL,
  ...,
  lineend = "butt",
  linejoin = "round",
  linemitre = 10,
  colour = "darkgray",
  size = 0.4,
  linetype = 1,
  alpha = NA,
  text.size = 3,
  family = "",
  salinity_type = c("practical", "absolute"),
  temperature_type = c("in-situ", "potential", "conservative"),
  ref_pressure = 0,
  ref_longitude = NULL,
  ref_latitude = NULL,
  trim_freezing = TRUE,
  breaks = pretty,
  labels = identity,
  label_placer = label_placer_isopycnal(),
  n_breaks = 5,
  n_sal = 200,
  n_temp = 200,
  eos = getOption("oceEOS", default = "gsw"),
  na.rm = FALSE,
  show.legend = NA,
  inherit.aes = TRUE
)

GeomIsopycnal
Arguments
| mapping | Set of aesthetic mappings created by |
|---|---|
| data | The data to be displayed in this layer. There are three options: If A A |
| ... | Other arguments passed on to |
| lineend, linejoin, linemitre, colour, size, linetype, alpha | Customize
the appearance of contour lines. See |
| text.size, family | Customize the appearance of contour line labels.
See |
| salinity_type | A salinity value. Use
|
| temperature_type | A temperature value. Use
|
| ref_pressure | The pressure that should be used to calculate density contours in dbar. |
| ref_longitude | The latitude and longitude that should
be used in seawater calculations if |
| ref_latitude | The latitude and longitude that should
be used in seawater calculations if |
| trim_freezing | Don't draw contours outside the freezing region. |
| breaks | A numeric vector or function used to generate breaks from objects. |
| labels | A function or vector of labels with which isopycnals should be labeled. |
| label_placer | See |
| n_breaks | Passed to |
| n_sal | Number of points with which contours should be approximated on the salinity axis. |
| n_temp | Number of points with which contours should be approximated on the temperature axis. |
| eos | The equation of state: one of "unesco" or "gsw". See
|
| na.rm | If |
| show.legend | logical. Should this layer be included in the legends?
|
| inherit.aes | If |
Format
An object of class GeomIsopycnal (inherits from Geom, ggproto, gg) of length 5.
Value
Examples
library(ggplot2)
data(ctd, package = "oce")

ggplot(ctd, aes(salinity, temperature)) +
  geom_isopycnal() +
  geom_point()