Spatial-aware scalebar annotation
annotation_scale(
  mapping = NULL,
  data = NULL,
  ...,
  plot_unit = NULL,
  bar_cols = c("black", "white"),
  line_width = 1,
  height = unit(0.25, "cm"),
  pad_x = unit(0.25, "cm"),
  pad_y = unit(0.25, "cm"),
  text_pad = unit(0.15, "cm"),
  text_cex = 0.7,
  text_face = NULL,
  text_family = "",
  tick_height = 0.6
)

GeomScaleBar
Format
An object of class GeomScaleBar (inherits from Geom, ggproto, gg) of length 5.
Arguments
- mapping, data, ...
See Aesthetics
- plot_unit
For non-coord_sf applications, specify the unit for x and y coordinates. Must be one of km, m, cm, mi, ft, or in.
- bar_cols
Colours to use for the bars
- line_width
Line width for scale bar
- height
Height of scale bar
- pad_x, pad_y
Distance between scale bar and edge of panel
- text_pad, text_cex, text_face, text_family
Parameters for label
- tick_height
Height of ticks relative to height of scale bar
Value
A ggplot2 layer.
Aesthetics
The following can be used as parameters or aesthetics. Using them as
aesthetics is useful when facets are used to display multiple panels,
and a different (or missing) scale bar is required in different panels.
Otherwise, just pass them as arguments to annotation_scale.
width_hint: The (suggested) proportion of the plot area which the scalebar should occupy.
unit_category: Use "metric" or "imperial" units.
style: One of "bar" or "ticks"
location: Where to put the scale bar ("tl" for top left, etc.)
line_col and text_col: Line and text colour, respectively
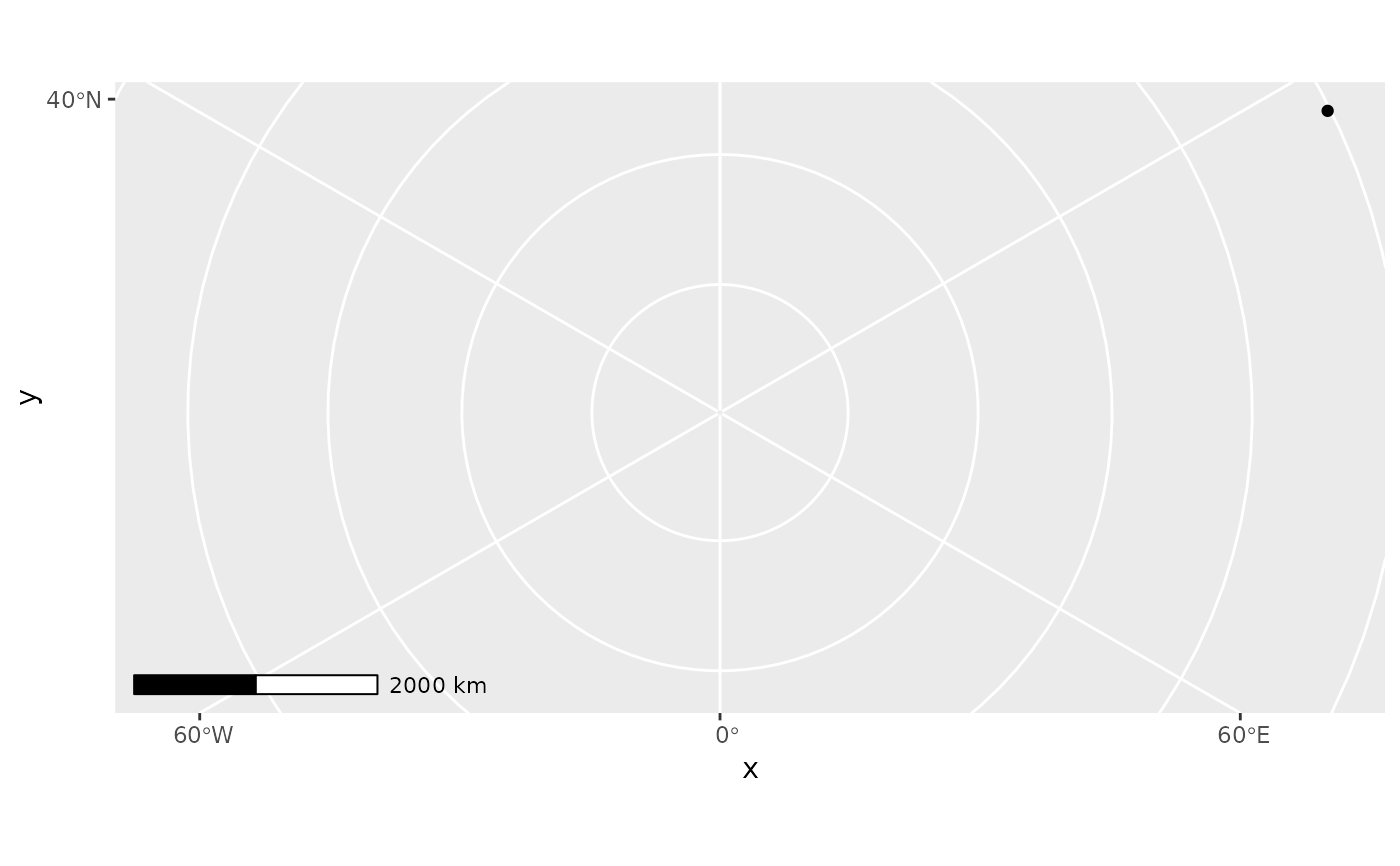
Examples
cities <- data.frame(
  x = c(-63.58595, 116.41214),
  y = c(44.64862, 40.19063),
  city = c("Halifax", "Beijing")
)

ggplot(cities) +
  geom_spatial_point(aes(x, y), crs = 4326) +
  annotation_scale() +
  coord_sf(crs = 3995)