Projected horizontal and vertical lines
annotation_spatial_hline(
  mapping = NULL,
  data = NULL,
  stat = "identity",
  ...,
  intercept = waiver(),
  limits = NULL,
  detail = 100,
  crs = NULL,
  na.rm = FALSE,
  show.legend = NA
)

annotation_spatial_vline(
  mapping = NULL,
  data = NULL,
  stat = "identity",
  ...,
  intercept = waiver(),
  limits = NULL,
  detail = 100,
  crs = NULL,
  na.rm = FALSE,
  show.legend = NA
)

GeomSpatialXline
Format
An object of class GeomSpatialXline (inherits from GeomHline, Geom, ggproto, gg) of length 4.
Arguments
- mapping
An aesthetic mapping created with
ggplot2::aes().- data
A data frame or other object, coerced to a data.frame by
ggplot2::fortify().- stat
Statistical transformation to use on this layer. See
ggplot2::layer().- ...
Passed to the combined stat/geom as parameters or fixed aesthetics.
- intercept
The x or y value that should be constant in the given
crs. Can also be passed as an aesthetic throughdataandmapping.- limits
Use
NULLto guess the minimum and maximum x or y value in the non-constant dimension, or specify a vector of length 2 to specify manually.- detail
The number of points that should be used when converting the line into segments.
- crs
The crs of the x and y aesthetics, or NULL to use default lon/lat crs (with a message).
- na.rm
Should missing aesthetic values be removed?
- show.legend
Should the legend be shown?
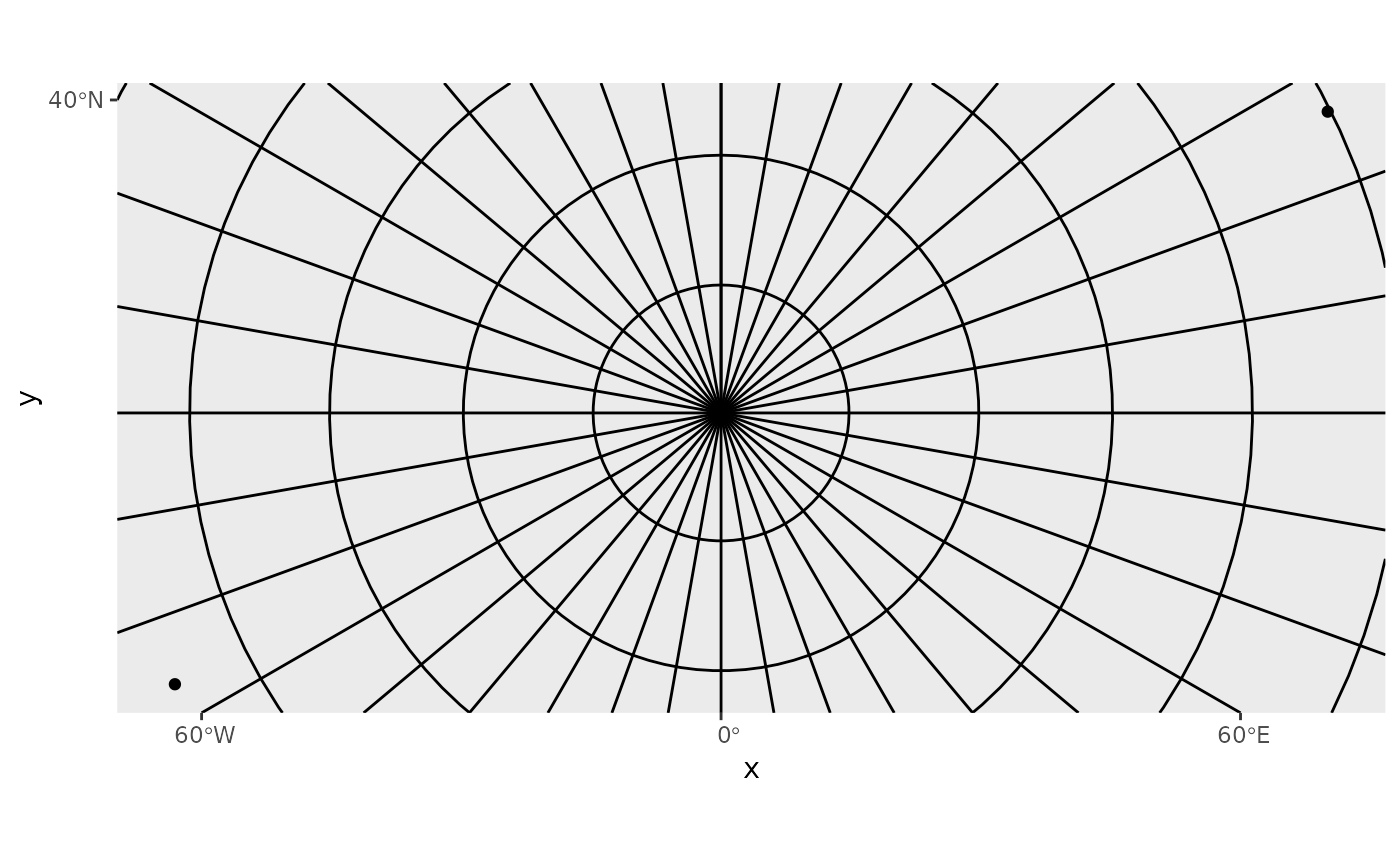
Examples
cities <- data.frame(
  x = c(-63.58595, 116.41214, 0),
  y = c(44.64862, 40.19063, 89.9),
  city = c("Halifax", "Beijing", "North Pole")
)

p <- ggplot(cities, aes(x, y, label = city)) +
  geom_spatial_point(crs = 4326) +
  # view of the north pole
  coord_sf(crs = 3995)

p +
  # longitude lines
  annotation_spatial_vline(
    intercept = seq(-180, 180, by = 10),
    crs = 4326
  ) +
  # latitude lines
  annotation_spatial_hline(
    intercept = seq(0, 90, by = 10),
    crs = 4326
  )