If you need to plot a sf::st_bbox(), use layer_spatial() instead.
While the implementation is slightly differrent, these functions are
intended to behave identically to ggplot2::geom_rect() and
ggplot2::geom_tile().
geom_spatial_rect(
  mapping = NULL,
  data = NULL,
  ...,
  crs = NULL,
  detail = 30,
  linejoin = "mitre",
  na.rm = FALSE,
  show.legend = NA,
  inherit.aes = TRUE
)

geom_spatial_tile(
  mapping = NULL,
  data = NULL,
  ...,
  crs = NULL,
  detail = 30,
  linejoin = "mitre",
  na.rm = FALSE,
  show.legend = NA,
  inherit.aes = TRUE
)

StatSpatialRect

StatSpatialTile
Format
An object of class StatSpatialRect (inherits from Stat, ggproto, gg) of length 4.
An object of class StatSpatialTile (inherits from StatSpatialRect, Stat, ggproto, gg) of length 4.
Arguments
- mapping
An aesthetic mapping created with
ggplot2::aes().- data
A data frame or other object, coerced to a data.frame by
ggplot2::fortify().- ...
Passed to the combined stat/geom as parameters or fixed aesthetics.
- crs
The crs of the x and y aesthetics, or NULL to use default lon/lat crs (with a message).
- detail
Passed to
sf::st_segmentize(): the number of line segments per quadrant of the bounding box. Increase this number for a smoother projected bounding box.- linejoin
How corners should be joined
- na.rm
Should missing aesthetic values be removed?
- show.legend, inherit.aes
See
ggplot2::layer().
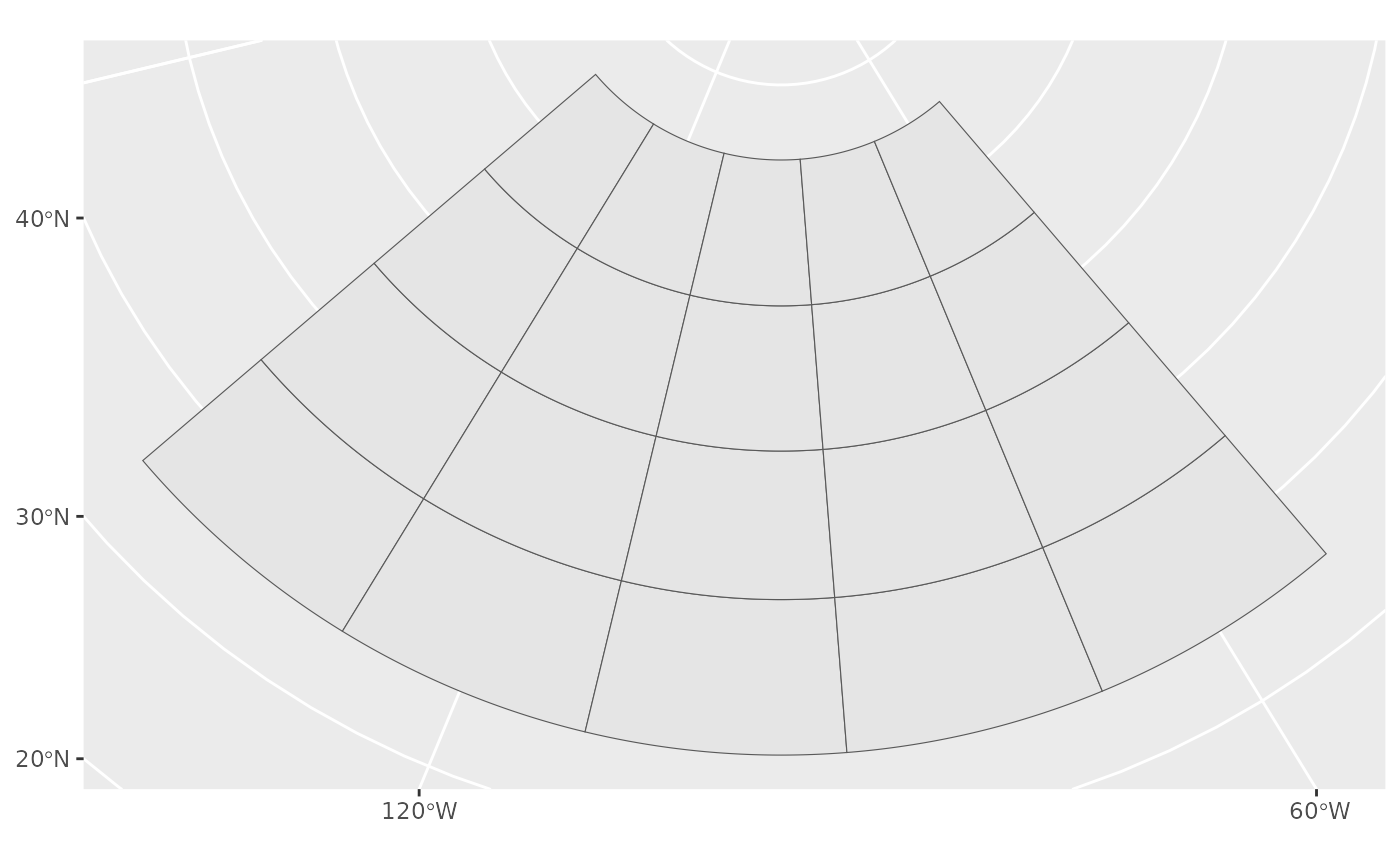
Examples
library(ggplot2)
tile_df <- expand.grid(
x = seq(-140, -52, by = 20),
y = seq(40, 70, by = 10)
)
ggplot(tile_df, aes(x, y)) +
geom_spatial_tile(crs = 4326) +
coord_sf(crs = 3979)
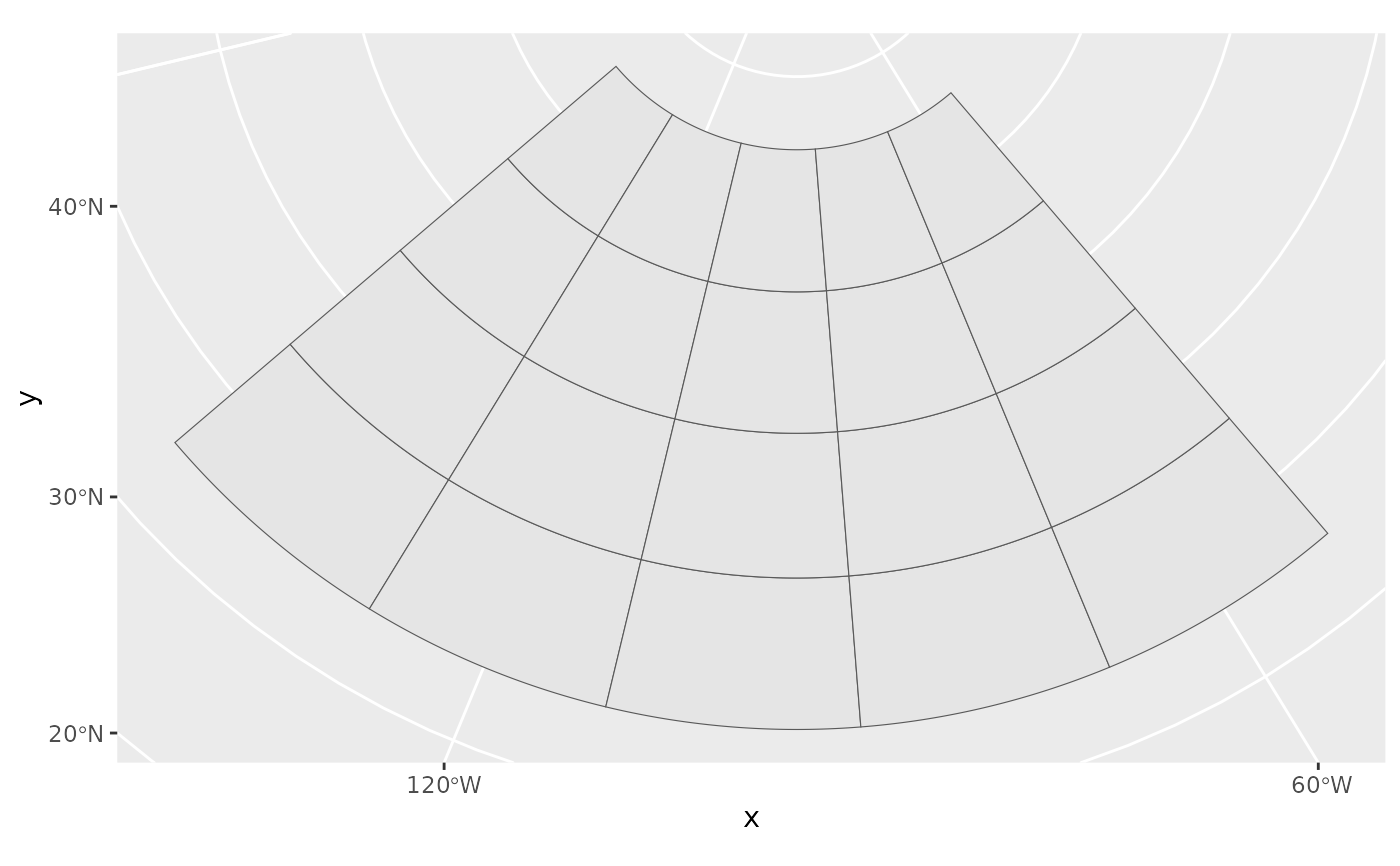 # the same plot using geom_spatial_rect()
ggplot(
tile_df,
aes(xmin = x - 10, xmax = x + 10, ymin = y - 5, ymax = y + 5)
) +
geom_spatial_rect(crs = 4326) +
coord_sf(crs = 3979)
# the same plot using geom_spatial_rect()
ggplot(
tile_df,
aes(xmin = x - 10, xmax = x + 10, ymin = y - 5, ymax = y + 5)
) +
geom_spatial_rect(crs = 4326) +
coord_sf(crs = 3979)