This is intended for use with RGB(A) rasters (e.g., georeferenced imagery or photos). To work with
bands as if they were columns, use df_spatial() and ggplot2::geom_raster().
# S3 method for class 'stars'
layer_spatial(
  data,
  mapping = NULL,
  interpolate = NULL,
  is_annotation = FALSE,
  lazy = FALSE,
  dpi = 150,
  options = character(0),
  ...
)

# S3 method for class 'stars'
annotation_spatial(data, mapping = NULL, interpolate = NULL, ...)

StatSpatialStars

StatSpatialStarsAnnotation

StatSpatialStarsDf

GeomSpatialStars
Format
An object of class StatSpatialStars (inherits from Stat, ggproto, gg) of length 3.
An object of class StatSpatialStars (inherits from StatSpatialStars, Stat, ggproto, gg) of length 3.
An object of class StatSpatialStarsDf (inherits from Stat, ggproto, gg) of length 5.
An object of class GeomSpatialStars (inherits from Geom, ggproto, gg) of length 5.
Arguments
- data
A stars object
- mapping
Currently, only RGB or RGBA rasters are supported. In the future, one may be able to map specific bands to the fill and alpha aesthetics.
- interpolate
Interpolate resampling for rendered raster image
- is_annotation
Lets raster exist without modifying scales
- lazy
Delay projection and resample of raster until the plot is being rendered
- dpi
if lazy = TRUE, the dpi to which the raster should be resampled
- options
GDAL options for warping/resampling (see st_warp)
- ...
Passed to other methods
Value
A ggplot2 layer
Examples
# \donttest{
library(ggplot2)
load_longlake_data(
which = c(
"longlake_osm",
"longlake_depth_raster"
),
raster_format = "stars"
)
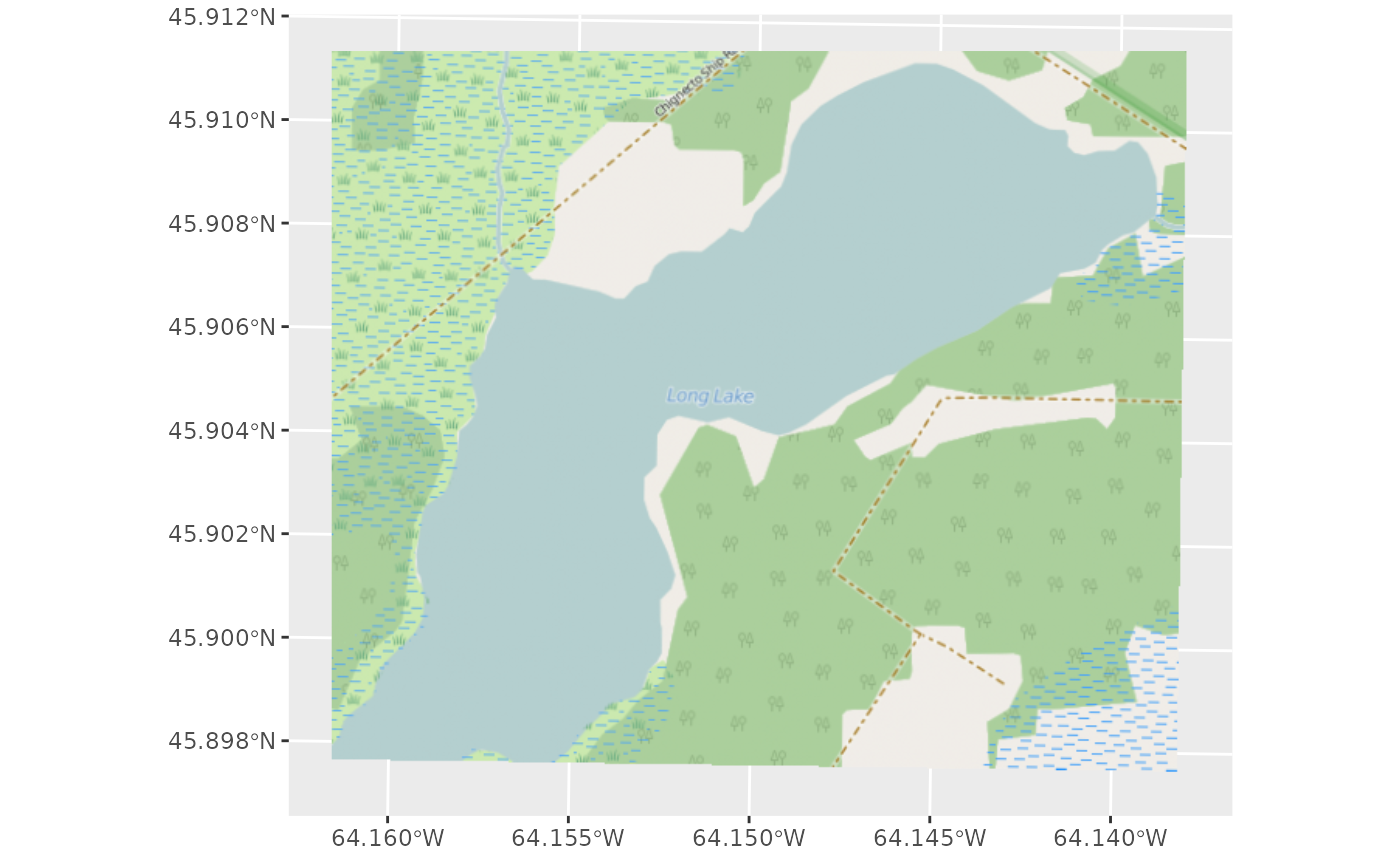
ggplot() +
layer_spatial(longlake_osm)
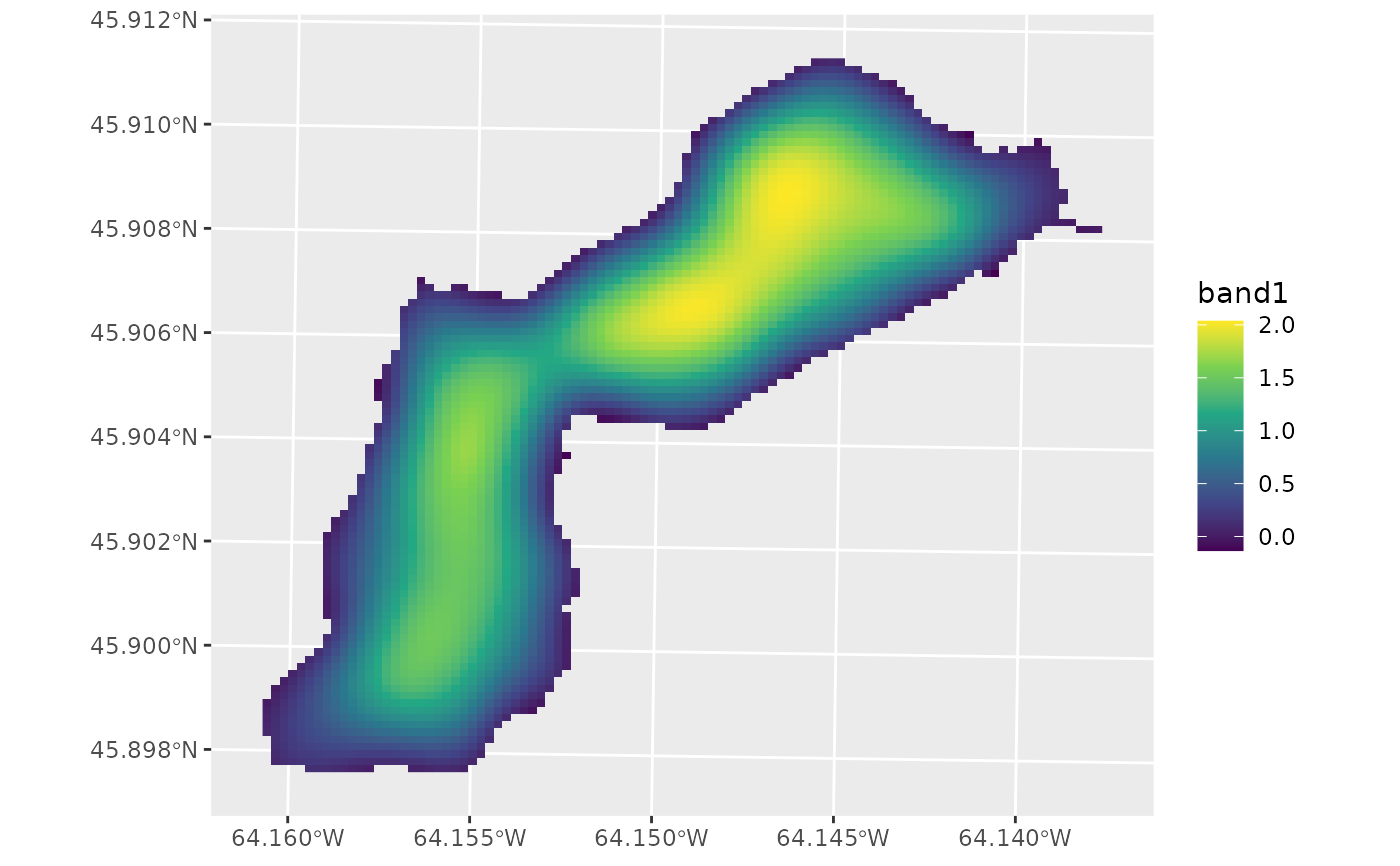
 ggplot() +
layer_spatial(longlake_depth_raster) +
scale_fill_continuous(
na.value = NA,
type = "viridis"
)
#> Warning: Removed 6584 rows containing missing values or values outside the scale range
#> (`geom_raster()`).
ggplot() +
layer_spatial(longlake_depth_raster) +
scale_fill_continuous(
na.value = NA,
type = "viridis"
)
#> Warning: Removed 6584 rows containing missing values or values outside the scale range
#> (`geom_raster()`).
 # }
# }