These functions send well-known geometry vectors to a
graphics device using graphics::points(),
graphics::lines(), and graphics::polypath(). These are
minimal wrappers aimed at developers who need to visualize
test data: they do not check geometry type and are unlikely
to work with vectorized graphical parameters in .... Use
the wk*_plot_new() functions to initialize a plot using the
extent of all coordinates in the vector.
wkb_draw_points(wkb, ...)

wkt_draw_points(wkt, ...)

wkb_draw_lines(wkb, ...)

wkt_draw_lines(wkt, ...)

wkb_draw_polypath(wkb, ..., rule = "evenodd")

wkt_draw_polypath(wkt, ..., rule = "evenodd")

wkb_plot_new(
  wkb,
  ...,
  asp = 1,
  xlab = "",
  ylab = "",
  main = deparse(substitute(wkb))
)

wkt_plot_new(
  wkt,
  ...,
  asp = 1,
  xlab = "",
  ylab = "",
  main = deparse(substitute(wkt))
)
Arguments
- wkb
A
list()ofraw()vectors, such as that returned bysf::st_as_binary().- ...
Passed to
graphics::points(),graphics::lines(), orgraphics::polypath()- wkt
A character vector containing well-known text.
- rule
Passed to
graphics::polypath()- asp, xlab, ylab, main
Passed to
graphics::plot()to initialize a new plot.
Value
The input, invisibly
Examples
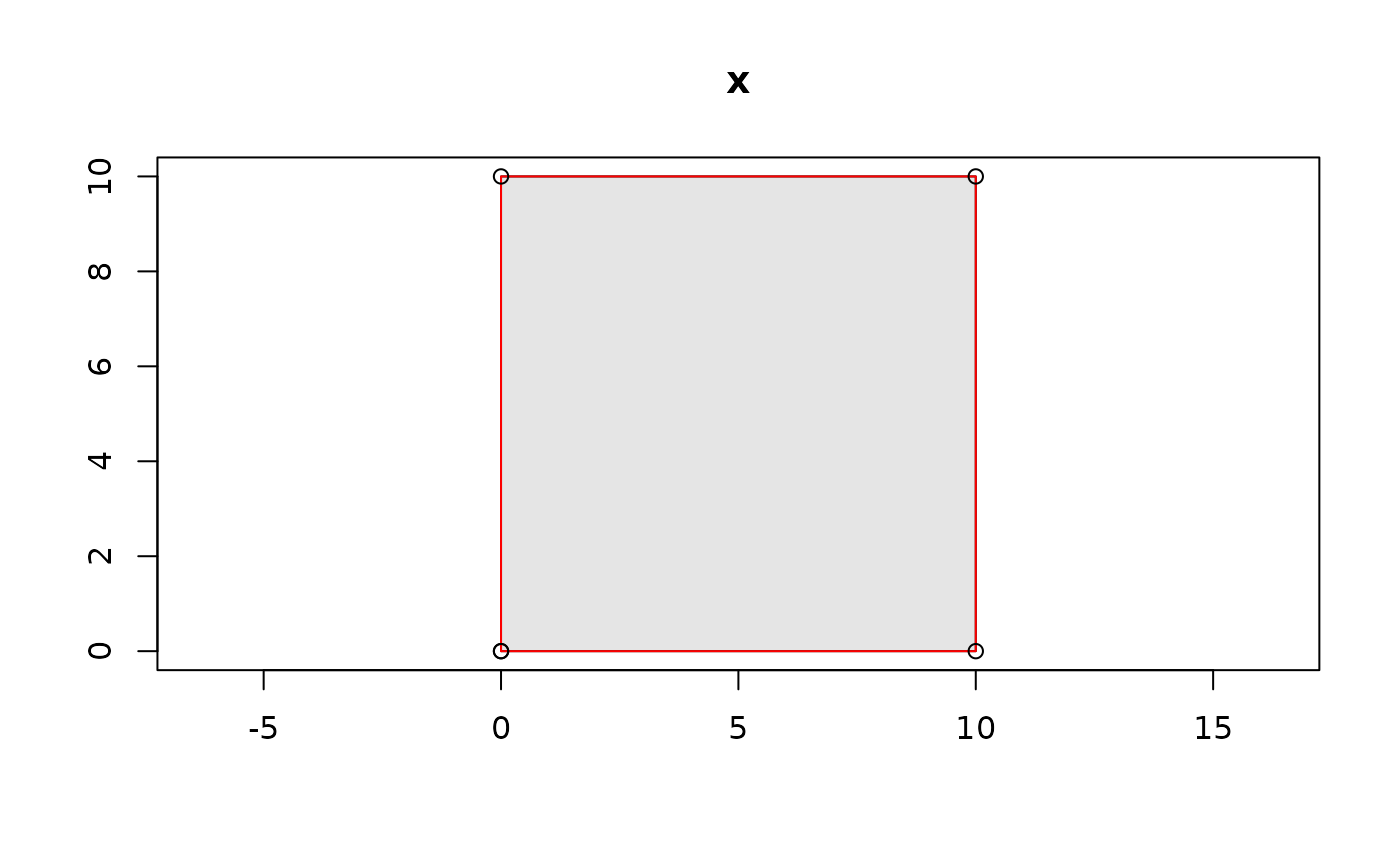
x <- "POLYGON ((0 0, 10 0, 10 10, 0 10, 0 0))"

wkt_plot_new(x)
wkt_draw_polypath(x, col = "grey90")
wkt_draw_lines(x, col = "red")
wkt_draw_points(x)
