The goal of edwards97 is to implement the Edwards (1997) Langmuir-based semiempirical coagulation model, which predicts the concentration of organic carbon remaining in water after treatment with an Al- or Fe-based coagulant. Methods and example data are provided to optimise empirical coefficients.
This package is experimental, under constant development, and is in no way guaranteed to give accurate predictions (yet).
Installation
You can install the development version from GitHub with:
# install.packages("remotes")
remotes::install_github("paleolimbot/edwards97")
Example
This is a basic example which shows you how to solve a common problem:
library(edwards97)

fit_data_alum <- edwards_data("Al")

# optimise coefficients for this dataset
fit <- fit_edwards_optim(fit_data_alum, initial_coefs = edwards_coefs("Al"))

# view fit results
print(fit)
#> <edwards_fit_optim>
#>   Fit optimised for `fit_data_alum`
#>   Coefficients:
#>     x3 = 5.14, x2 = -72.4, x1 = 259, K1 = -0.107, K2 = 0.562, b = 0.0951, root = -1
#>   Performance:
#>     r^2 = 0.955, RMSE = 0.935 mg/L, number of finite observations = 500
#>   Input data:
#>       DOC             dose                pH            UV254
#>  Min.   : 1.80   Min.   :0.008378   Min.   :4.500   Min.   :0.0260
#>  1st Qu.: 2.81   1st Qu.:0.132264   1st Qu.:5.808   1st Qu.:0.0810
#>  Median : 3.94   Median :0.228983   Median :6.500   Median :0.1060
#>  Mean   : 6.36   Mean   :0.264423   Mean   :6.430   Mean   :0.2323
#>  3rd Qu.: 6.70   3rd Qu.:0.354291   3rd Qu.:6.955   3rd Qu.:0.2470
#>  Max.   :26.50   Max.   :1.515151   Max.   :7.900   Max.   :1.3550
#>    DOC_final       Predictions       Langmuir a     Sorbable DOC (%)
#>  Min.   : 1.030   Min.   : 0.775   Min.   : 30.25   Min.   : 59.05
#>  1st Qu.: 1.968   1st Qu.: 1.984   1st Qu.: 32.92   1st Qu.: 67.62
#>  Median : 2.700   Median : 2.748   Median : 41.22   Median : 75.32
#>  Mean   : 3.793   Mean   : 3.774   Mean   : 52.58   Mean   : 76.72
#>  3rd Qu.: 4.025   3rd Qu.: 4.286   3rd Qu.: 70.51   3rd Qu.: 82.34
#>  Max.   :26.610   Max.   :20.430   Max.   :168.85   Max.   :105.16
plot(fit)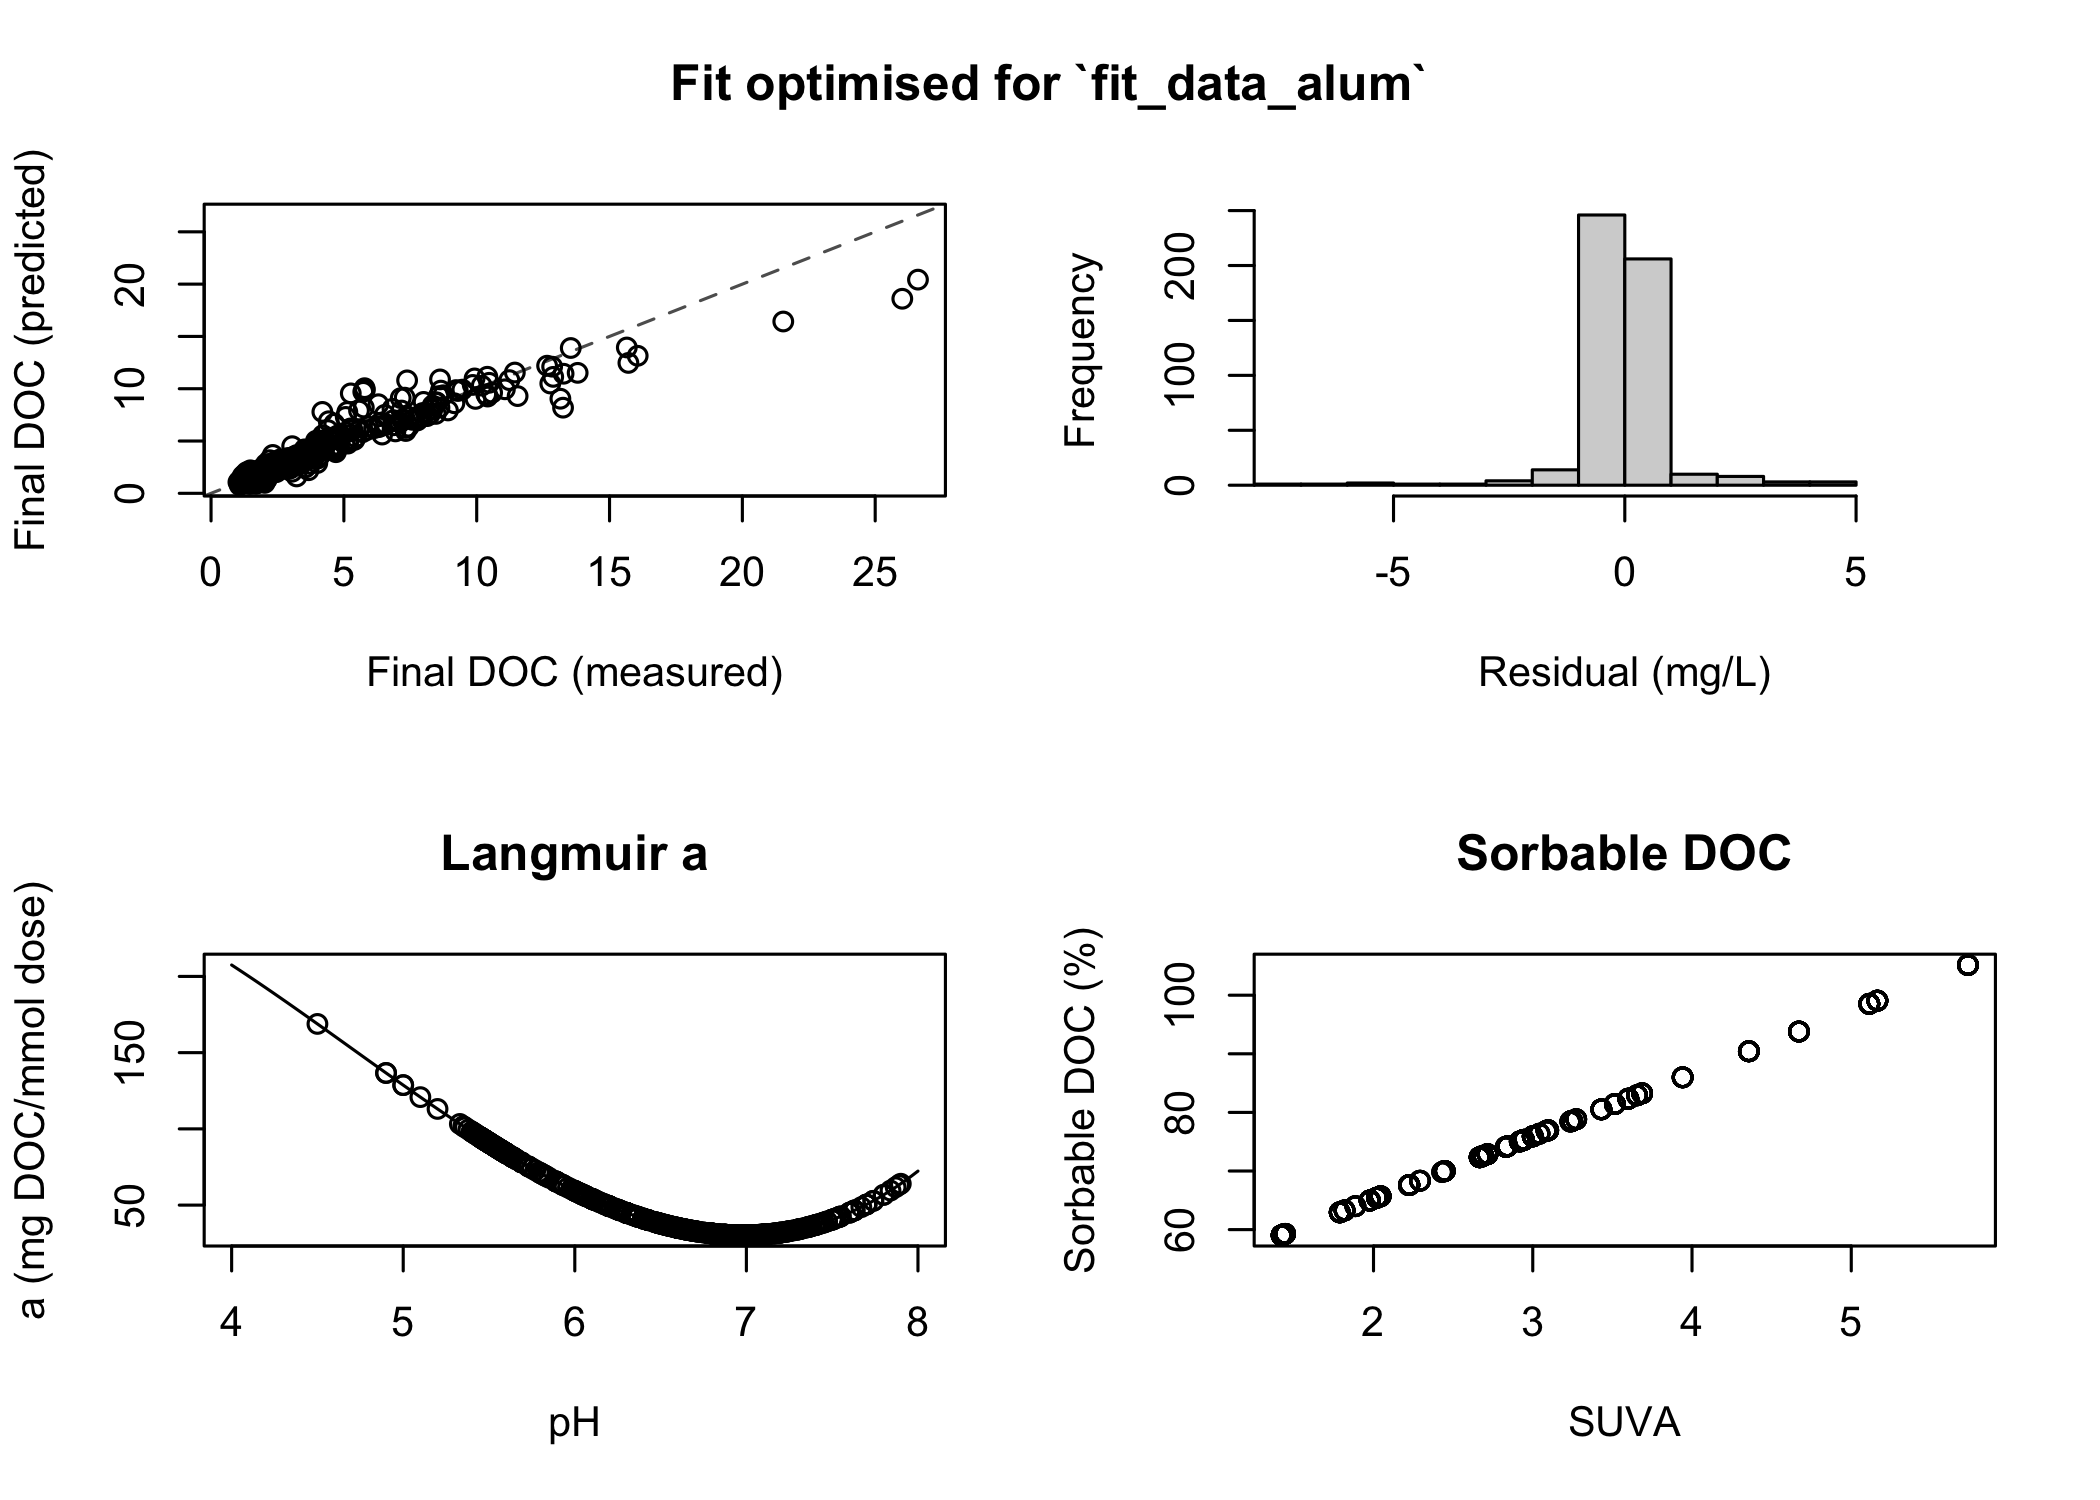
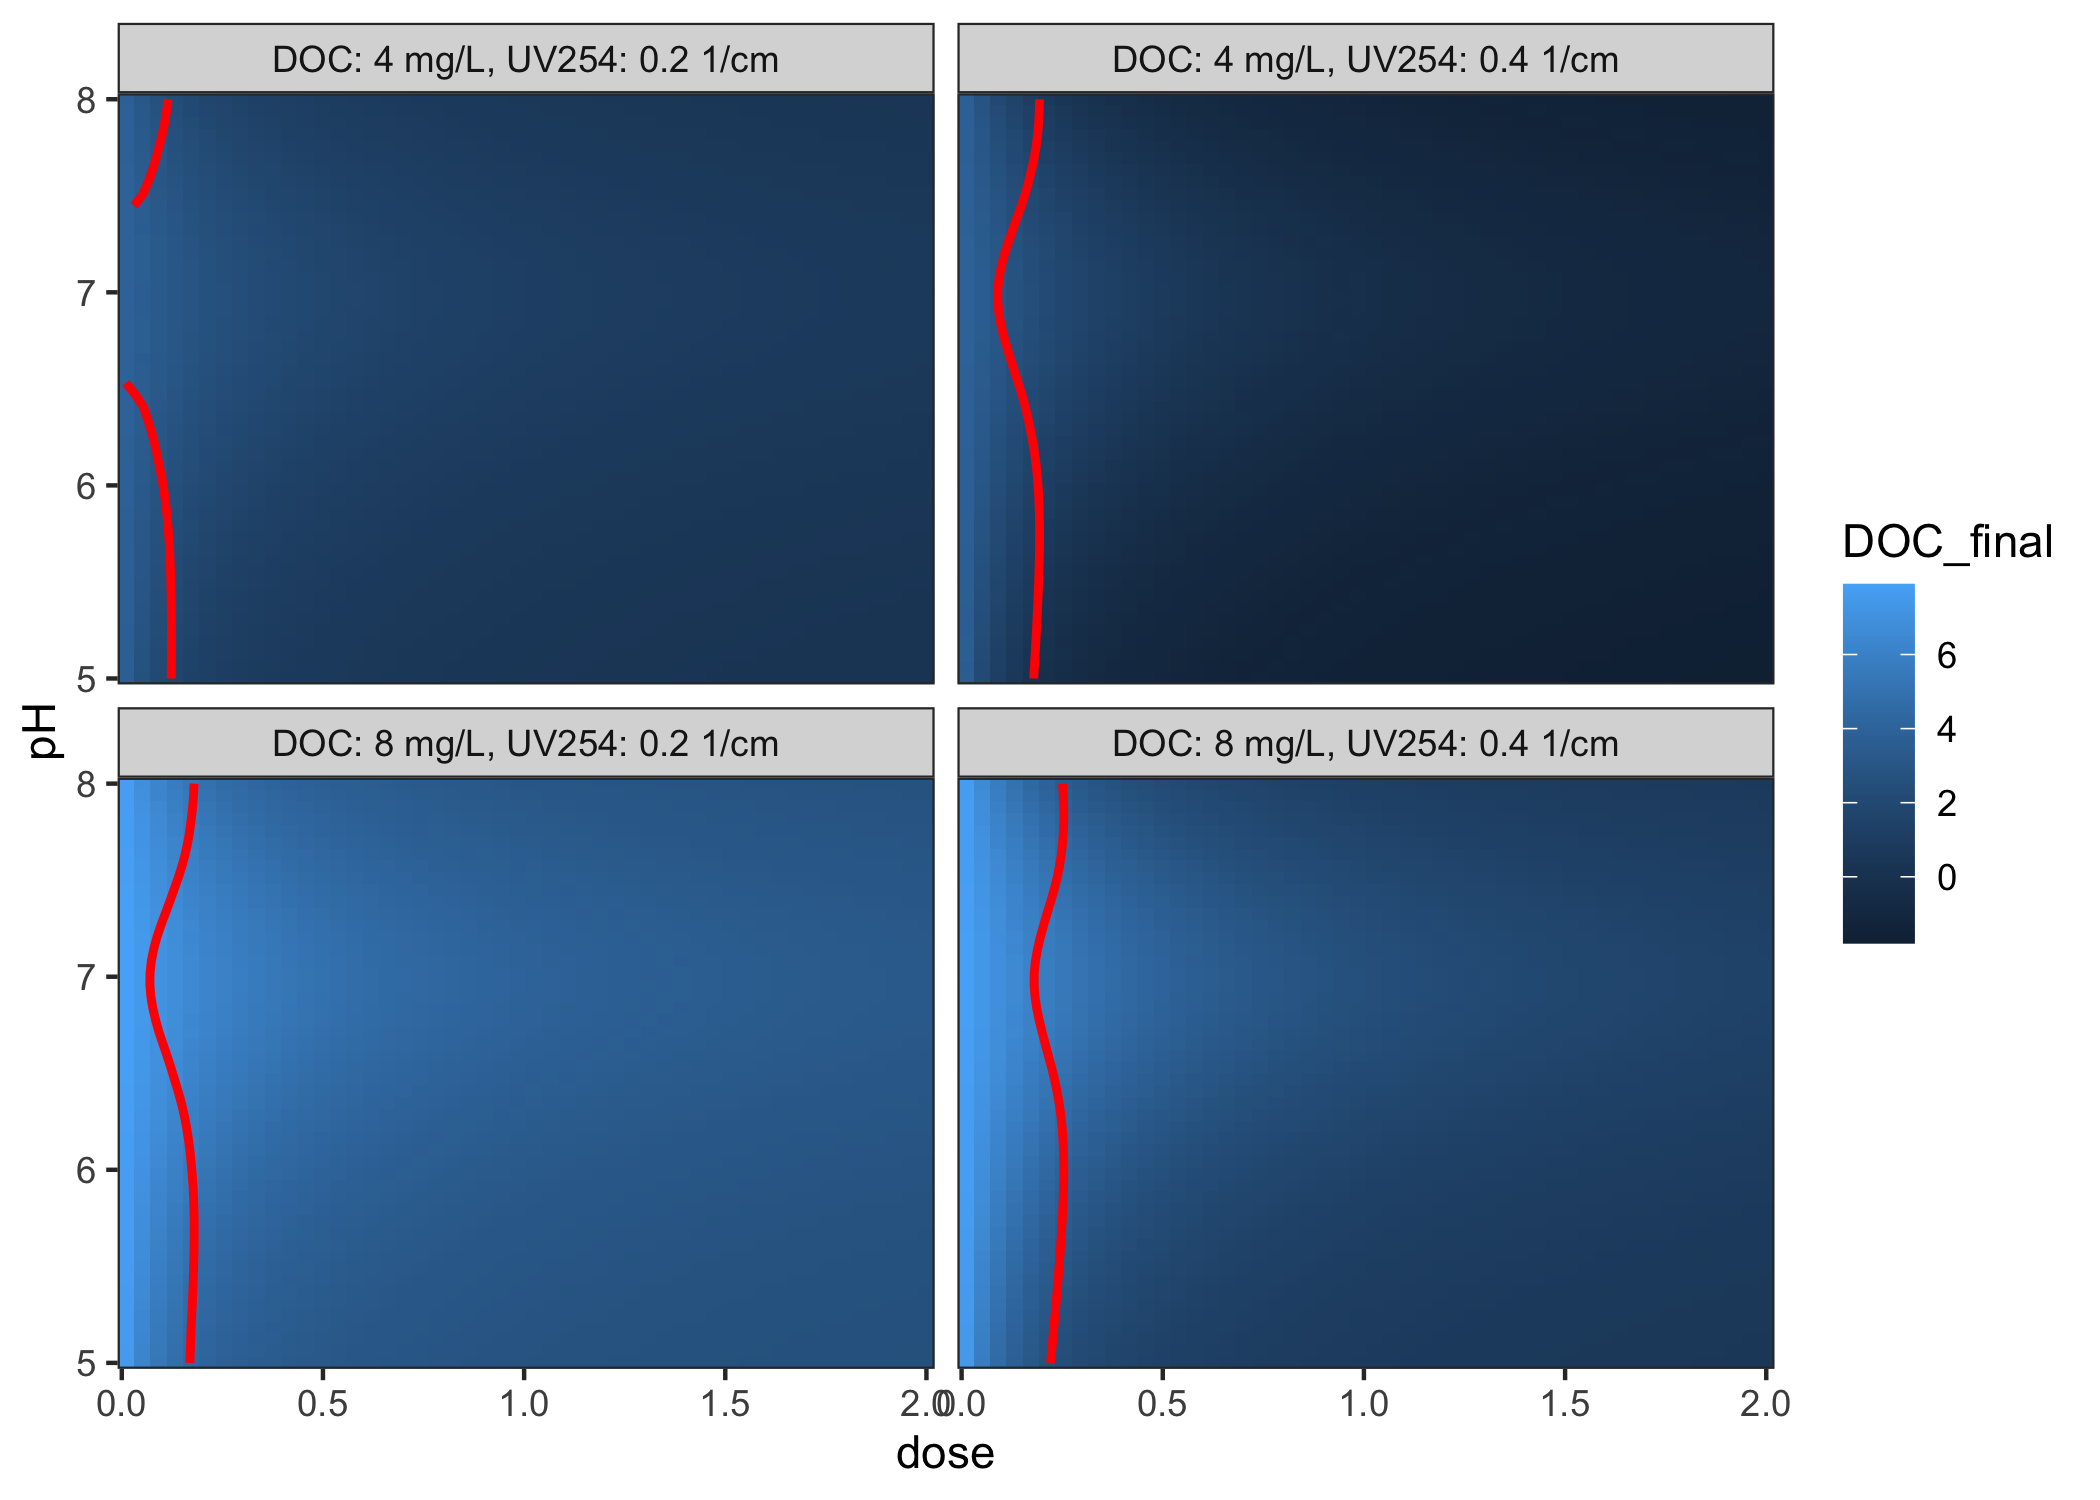
Using the fit, you can make predictions about unknown inputs:
grid <- coagulate_grid(fit, DOC = c(4, 8), UV254 = c(0.2, 0.4)) %>%
  mutate(label = glue::glue("DOC: {DOC} mg/L, UV254: {UV254} 1/cm"))

diminishing_returns <- grid %>%
  group_by(label, pH) %>%
  summarise(dose = dose_of_diminishing_returns(dose, DOC_final, threshold = 0.3 / 10))
#> `summarise()` has grouped output by 'label'. You can override using the
#> `.groups` argument.

ggplot(grid, aes(x = dose, y = pH)) +
  geom_raster(aes(fill = DOC_final)) +
  geom_path(data = diminishing_returns, col = "red", size = 1) +
  facet_wrap(vars(label)) +
  coord_cartesian(expand = FALSE)