Plot an election map
plot_election_map(years = 2006:2019, provinces = election_provinces())

plot_election(years = 2006:2019, provinces = election_provinces())
Arguments
| years | A vector of |
|---|---|
| provinces | One or more |
Value
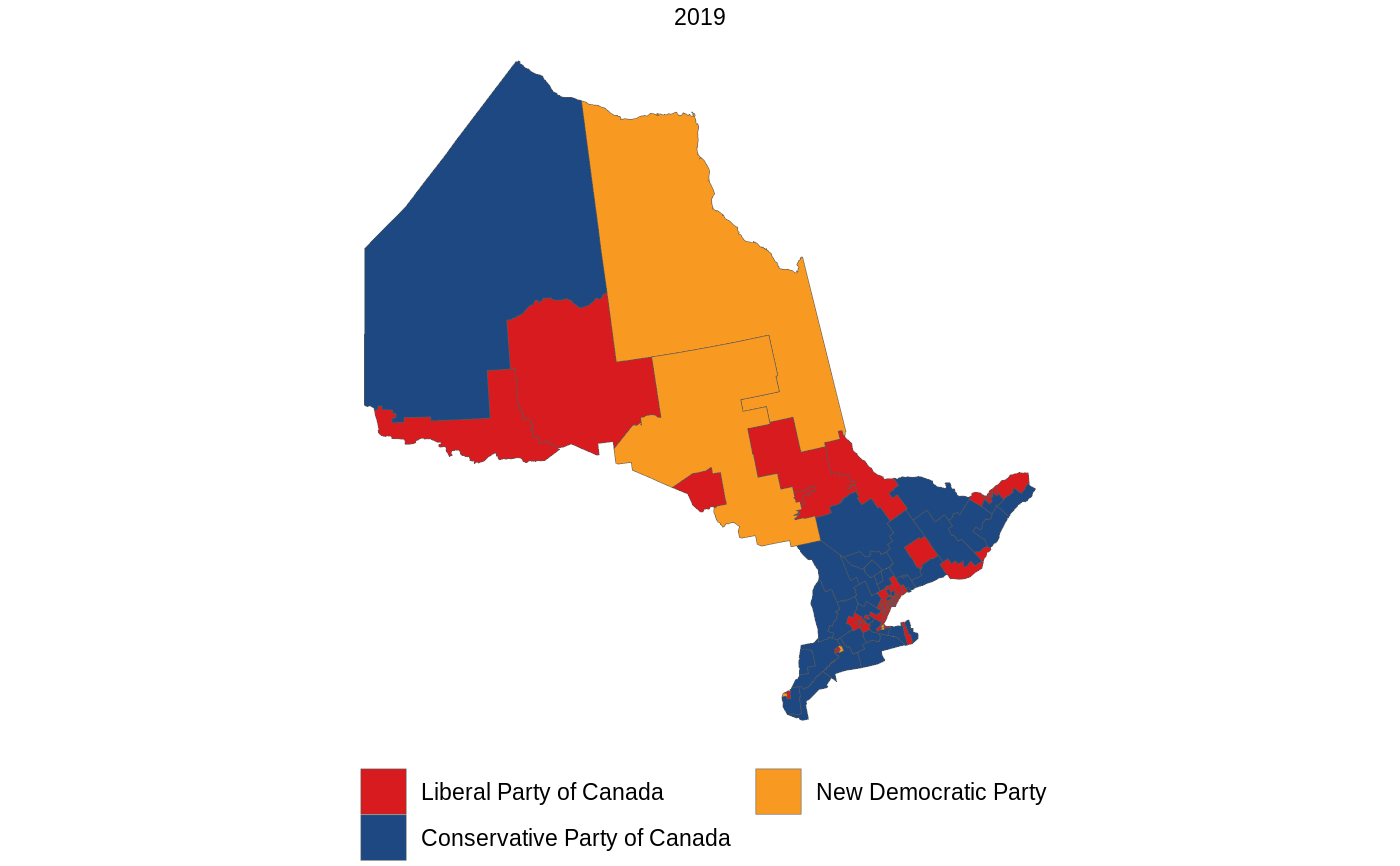
Examples
plot_election(2019, "Ontario")plot_election_map(2019, "Ontario")