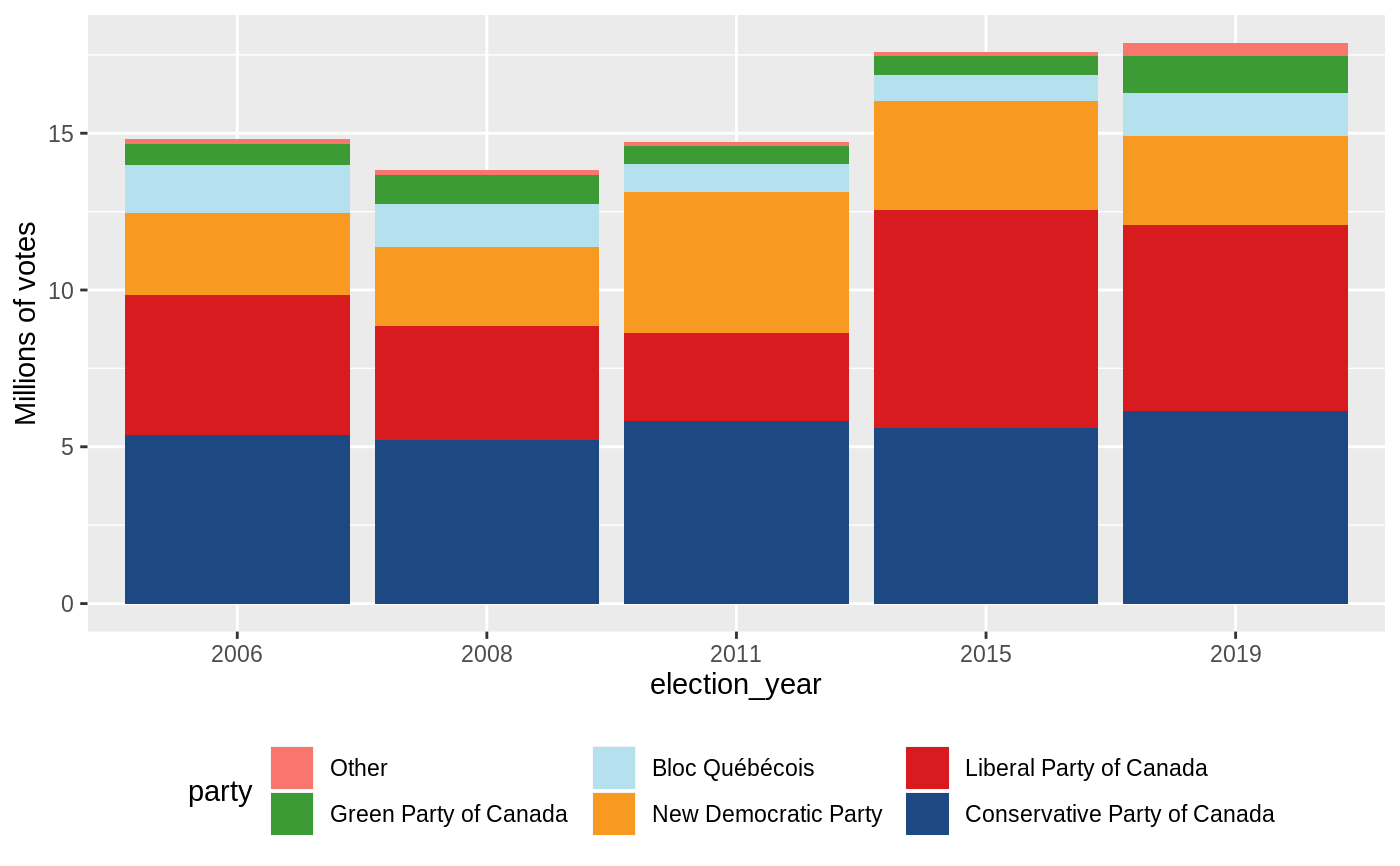
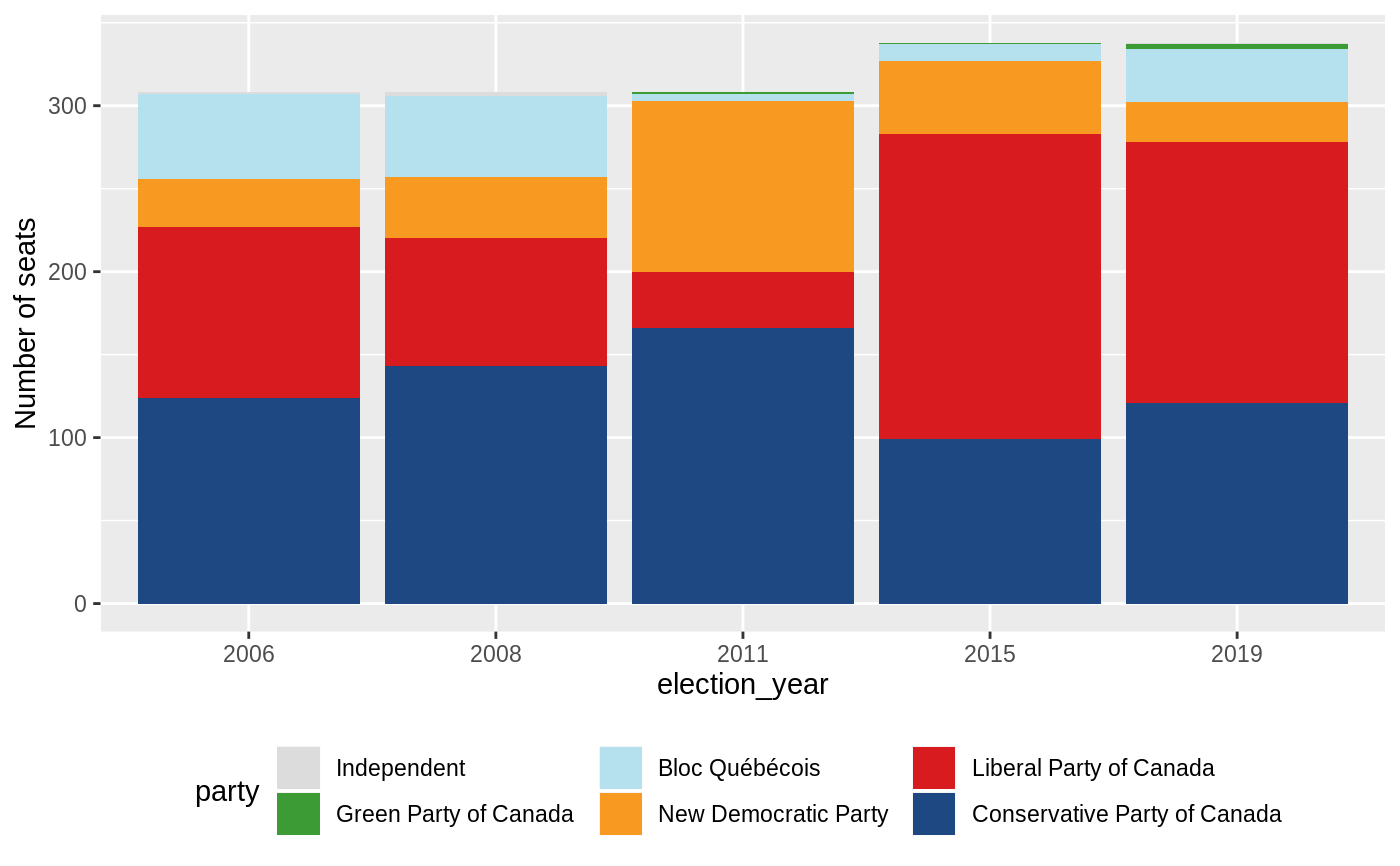
Plots the number of votes or the number of seats as a bar chart. Use
position = "fill" to visualize vote proportions.
plot_votes(
  years = 2006:2019,
  provinces = election_provinces(),
  x_var = "election_year",
  fill_var = "party",
  facet_var = NULL,
  facet_scales = "fixed",
  position = "stack",
  n_parties = 5
)

plot_seats(
  years = 2006:2019,
  provinces = election_provinces(),
  x_var = "election_year",
  fill_var = "party",
  facet_var = NULL,
  facet_scales = "fixed",
  position = "stack"
)
Arguments
| years | One or more |
|---|---|
| provinces | One or more |
| x_var, fill_var | A variable in |
| facet_var | A variable to use with |
| facet_scales | Scales, most usefully "free" or "fixed". |
| position | A position, most usefully "stack" or "fill". |
| n_parties | The number of parties to include. |
Value
Examples
plot_votes()plot_seats()