Unlike grd_tile_template(), which returns a grd() whose elements are
the boundaries of the specified tiles with no data attached, grd_tile()
returns the actual tile with the data.
grd_tile(grid, level, i, j = NULL)

# S3 method for class 'wk_grd_rct'
grd_tile(grid, level, i, j = NULL)

# S3 method for class 'wk_grd_xy'
grd_tile(grid, level, i, j = NULL)
Arguments
- grid
A
grd_xy(),grd_rct(), or other object implementinggrd_*()methods.- level
An integer describing the overview level. This is related to the
stepvalue by a power of 2 (i.e., a level of1indicates a step of2, a level of2indicates a step of4, etc.).- i, j
1-based index values.
iindices correspond to decreasingyvalues;jindices correspond to increasingxvalues. Values outside the range1:nrow|ncol(data)will be censored toNAincluding 0 and negative values.
Value
A grd_subset()ed version
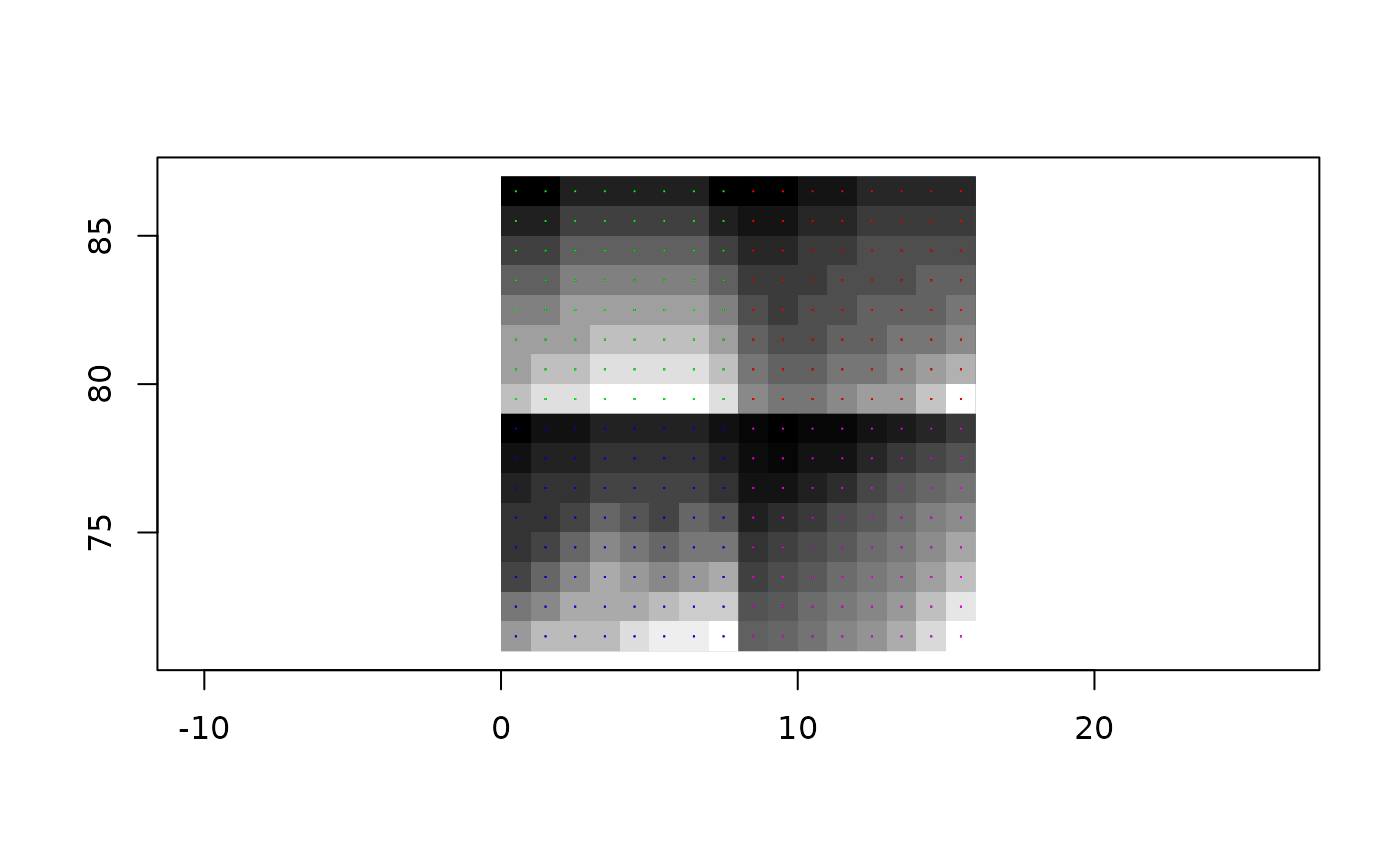
Examples
grid <- grd_rct(volcano)
plot(grd_tile(grid, 4, 1, 1))

plot(grd_tile(grid, 3, 1, 1), add = TRUE)
plot(grd_tile(grid, 3, 1, 2), add = TRUE)
plot(grd_tile(grid, 3, 2, 1), add = TRUE)
plot(grd_tile(grid, 3, 2, 2), add = TRUE)

grid <- as_grd_xy(grd_tile(grid, 4, 1, 1))
plot(grid, add = TRUE, pch = ".")
plot(grd_tile(grid, 3, 1, 1), add = TRUE, col = "green", pch = ".")
plot(grd_tile(grid, 3, 1, 2), add = TRUE, col = "red", pch = ".")
plot(grd_tile(grid, 3, 2, 1), add = TRUE, col = "blue", pch = ".")
plot(grd_tile(grid, 3, 2, 2), add = TRUE, col = "magenta", pch = ".")