Add scores to a plot
layer_scores(
  object,
  mapping = NULL,
  which = "PC1",
  key = "param",
  value = "value",
  scores_geom = list(ggplot2::geom_path(), ggplot2::geom_point()),
  sequential_facets = TRUE
)

plot_layer_scores(
  object,
  mapping,
  which = "PC1",
  key = "param",
  value = "value",
  ...
)
Arguments
- object
A nested_prcomp or similar object
- mapping
A mapping created with aes
- which
Which principal components to plot
- key
The column name to use for the principal component names
- value
The column name to use for the principal component score values
- scores_geom
One or more geometries to which scores should be applied.
- sequential_facets
TRUE will result in the panel containing the dendrogram added to the right of the plot.
- ...
Passed to layer_scores()
Value
A list() that can be addeed to a ggplot2::ggplot()
Examples
library(ggplot2)
library(dplyr, warn.conflicts = FALSE)

alta_pca <- nested_data(
  alta_lake_geochem,
  qualifiers = c(age, depth, zone),
  key = param,
  value = value,
  trans = scale
) %>%
  nested_prcomp()

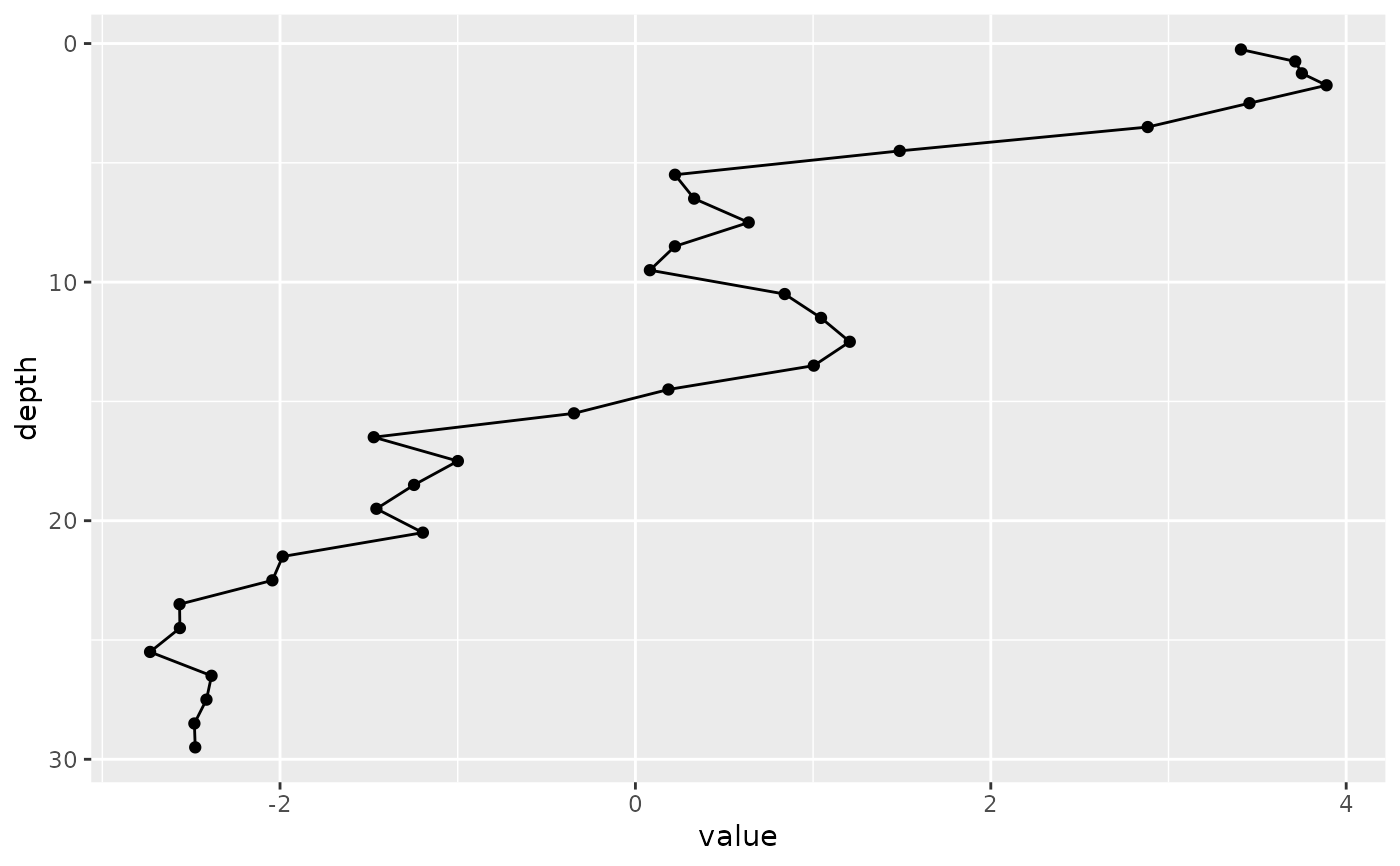
ggplot() +
  layer_scores(alta_pca, aes(value, depth), which = "PC1") +
  scale_y_reverse()


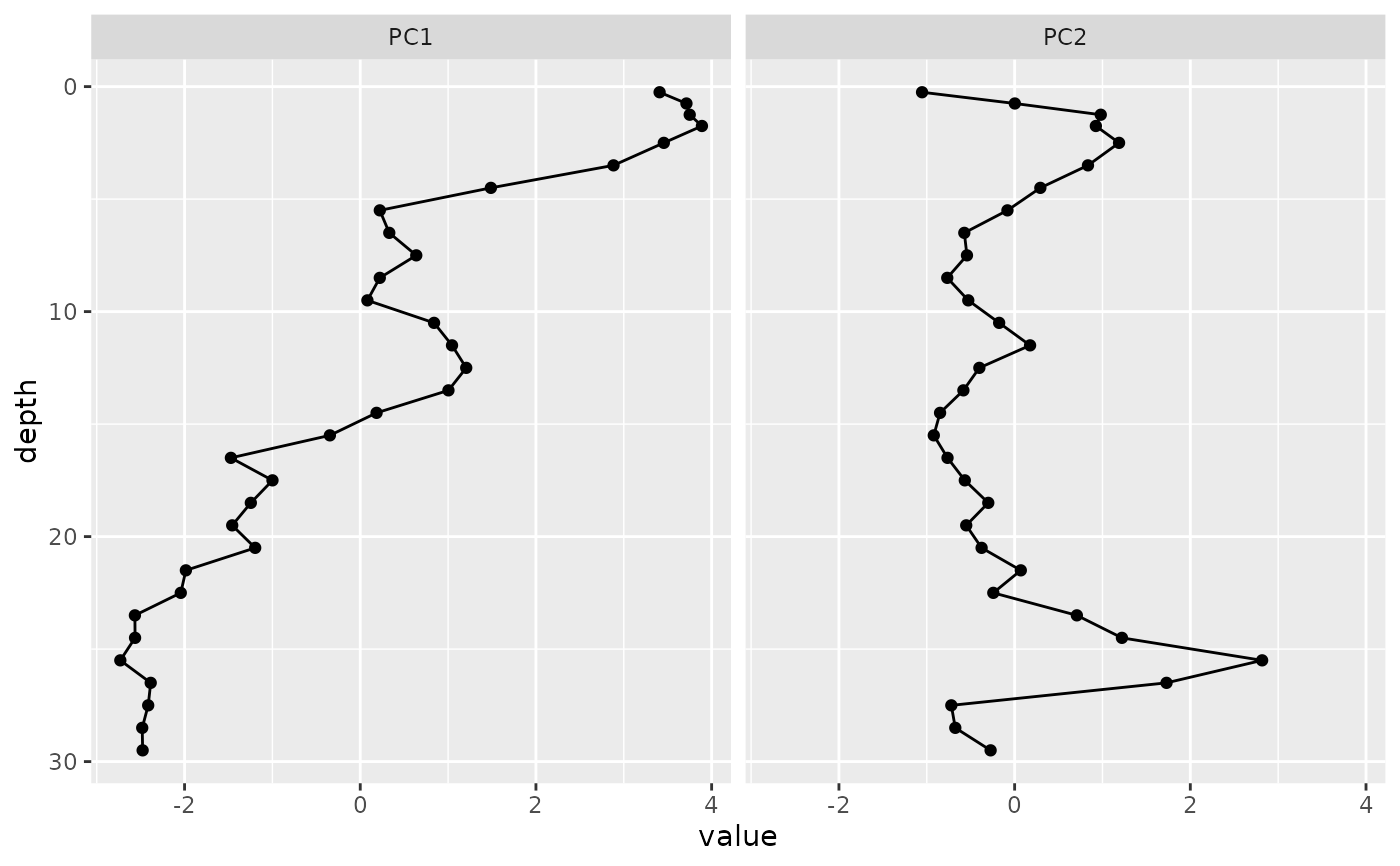
plot_layer_scores(alta_pca, aes(y = depth), which = c("PC1", "PC2")) +
  scale_y_reverse()
